The Art of execution
August 23, 2023
6 mins
.jpg)
For many traders, the ultimate goal of trading is not money, but freedom. However, we often adopt trading styles and rules from other traders that do not align with our lifestyle and goals. As a result, many of our peers have quit after only a few months.
Here's how I've adapted my trading methods over the years:
The years 2021 and 2022 were very successful trading years for me. However, the demands of balancing work, family, and Mumbai commutes were taking a heavy toll on my physical and mental health. I never got into the habit of checking prices during the day, but I recall the office hours after 3:30 having a different “feel”. In addition, I spent a significant amount of time outside of work hours (~30 hours per week) scanning, reviewing, and executing trades due to the bull market.
Here is my P&L distribution curve for 2021:
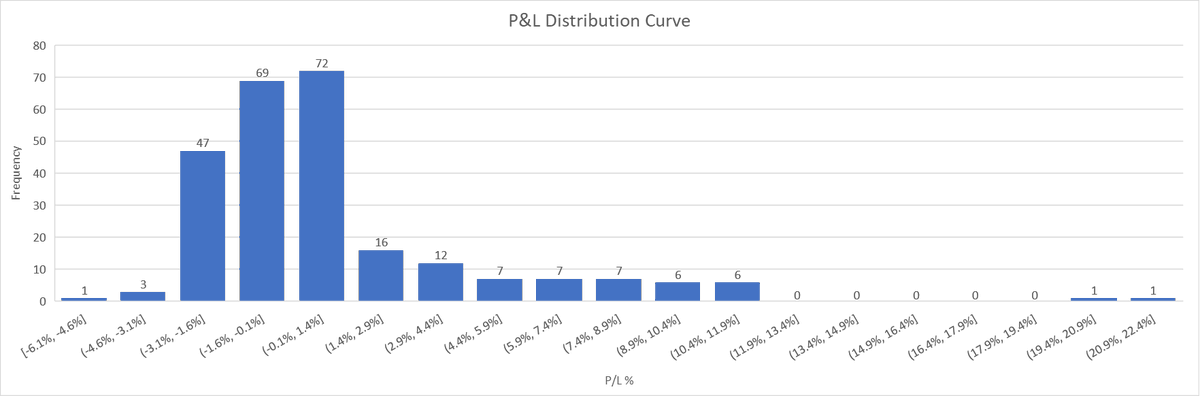
If you observe, 216 trades (47+69+72+16+12) out of 263 trades nearly cancelled each other out, meaning 5 out of my 6 trades had no effect on my portfolio. I understand that this is a skewed hindsight bias and goes against the basic logic of trading probabilities. However, the fact that 83% of trades result in no bottom-line impact indicates a low effort-to-reward ratio, especially when I had an average of 1+ trade per day.
After averaging the other 47 trades, I found that my win average is 7%, which is pretty good considering my loss average of 1.5%. This prompted me to delve deeper into the characteristics of these 47 trades.
Your trading performance can be formulated as:
Expectancy * Frequency.Expectancy = (win rate x avg. gain per trade) - (loss rate x avg. loss per trade)
Frequency = No of trades
Lets break down the formula to its first principles:
Your win/loss rate and frequency will be greatly influenced by market conditions. During a bull market, such as the current one, these two factors will largely take care of themselves unless you mess it up.
Your average loss is determined by your initial stop loss and how early you can enter the trade & get the stoploss to cost. This is the only part of the equation that is entirely dependent on "YOU". Refer to my earlier post on July 2nd, 2023 on my improvement on stop loss.
The only area where you can significantly improve your effort-to-reward ratio is on the average gain. For this, I deep dived into the biggest winners of 2014, 2017 and 2020.
Many of the big winners in these years could be segregated into 3 major setups - IPO base, EP and Base Breakouts (5+ weeks). In fact, I only realized later that 39 out of my top 47 profitable trades were from these setups. I erred by focusing on the effect rather than the cause of these setups. These were also the stocks that moved up linearly and could have been simply trailed with a moving average for a big move.
This is where selling into weakness has a significant advantage. It is more aggressive, as it risks a larger portion of your unrealized profits. And, if you have an OCD like me and obsess over “how a trade would look in your journal”, this approach may go against your grain. However, what helped me take the leap of faith to this approach from my earlier hybrid approach (half sell in strength + trail half as in Minnervini books) was understanding the WHY of these setups and WHY I trade. Understanding these WHY's will help you create rules that are unique to your situation. These rules are more time and effort efficient and will better protect your portfolio from yourself.
Bull markets have intense activity and emotions of FOMO, euphoria, and envy, with many setups and breakouts happening daily. It is only amplified by Fintwits, who have posted more charts in the last 4 months than I have seen in the Minnervini and WON books combined.
This is where most traders, including myself, get swayed and replicate the systems of traders who can afford more screen time or are also into the content business, where more chart posting drives more follower engagement. In the midst of knowledge seeking, we often lose sight of the bigger picture and why we got into trading in the first place. The same VCP pattern can be managed in multiple ways and adjusted to fit into your daily life without sacrificing much profits.
Giving preference to trading over your primary occupation or education has had disastrous effects for most people. If Darvas can succeed at trading while dancing in a different continent, so can you. In fact, if you are a fulltime trader in your 20s and looking to get married, you will have a difficult time convincing your future in-laws to agree to their daughter marrying you.
Trading may not be a suitable primary business for most people, but it is an excellent second business to pursue.

August 23, 2023
6 mins
November 14, 2025
6 mins