The Art of execution
December 10, 2023
6 mins
.jpg)
There are two anchor biases that have caused significant losses or opportunity costs for market participants. The first is the investor bias that charts are irrelevant and that buying good value is sufficient for the long term. The second is the trader bias that all solutions can be found in charts
Market participants with the first bias are often willing to learn how to optimize their timing and risk using charts, particularly after bear markets when reality sets in. However, I have noticed that chartists are more resistant to study the fundamental catalysts that trigger the actions of institutions behind the chart patterns.
The institutions whom we are trying to follow by their clues on the charts, often take a fundamental view first and then may be a technical one to get a timing confirmation. Just because the potential fundamental catalysts are visible to them and not to you, does it make them lagging? And, if not, would you consider the chart to be lagging? Traders rely on charts because they provide an early opportunity to make decisions by optimizing time and risk. However, for the institution that is “creating” the charts, their informational edge about cashflows, growth and its risk will be leading indicators, not the charts themselves. Furthermore, all informational edges have an expiration date. Over the last 25 years, this edge has significantly reduced between institutional investors and retail traders.
Although efficient, relying solely on charts means following the shadows and breadcrumb trails of institutions. Your FAITH in buying and holding a stock will increase exponentially if you have a better understanding of the decisions made by institutions through their fundamental and sector catalysts. Situational awareness in trading combines chart reading with understanding institutional catalyst timing.
When starting to learn how to trade, most of our energy is spent on learning how and when to buy. This is natural, as capital is at risk and our first instinct is to protect it. We figure that once we make a “decent” profit in the stock, we’d just sell it. If you have been trading for the last three years (and especially in the last six months), you have likely faced more confusion and emotional pressure when selling at a profit than selling when your stop loss has been hit. The regret of selling a stock at a profit and seeing it move 2x from your selling point is probably greater than the regret of not having the stock on your buy list at all. Every trader has faced the thought, "I bought the stock at 100 and sold at 140, and now it's at 200. If I had still held the position, my portfolio would have increased by x%.”
Cash traders usually buy Stage 2 momentum stocks that exhibit range contraction as it reduces time and stop loss risks. However, reward maximisation depends on your selling strategy. When you are in a profitable position, the first decision you need to make is HOW MUCH of the position should you sell in strength and at what risk multiple (R). This decision is often not based on the charts, but on various factors such as your trade objective, recent performance, or the theory of using the profits to finance your next trade. Every sell in strength decision which compensates for your mental game gaps or process deficiencies, reduces the impact your home run winners will have on your portfolio. Trade journal analysis and post reviews helps identify which sell-in-strength ratio maximizes your home runs. Furthermore, it cancels out the opportunity of pyramiding by leveraging on unrealized profits. Your decision on HOW MUCH to hold or sell a stock will also be influenced by your FAITH in its upmove potential, and this must be determined before taking the trade.
Let’s take an example:
Setup: The stock is breaking out of a long base and showing range contraction on the right side of the base. On August 25th 2022, the stock formed a tight day (NR7) on low volumes.
Trade Objective: Will look to buy and hold the stock for a longer positional play as (a) it is breaking out of a year-long base (b) Relatively new listing yet to pick up momentum
Risk on Trade: 0.5% of portfolio
Selling Rule: Sell 50% of the position in strength at 4R and trail the balance position with 21ema. If there is a parabolic move, sell the entire position if the low of the previous day within the parabolic move is broken.
Entry: 26th August 2022 Entry 316, Stop Loss 1.5% - 311.2 (~Day low), Size - 28%
Sells: 50% Sell at 338.5 (4R) + 50% Sell at 821.258 - (105R) =54.5R
Impact on Portfolio: ~27.3%
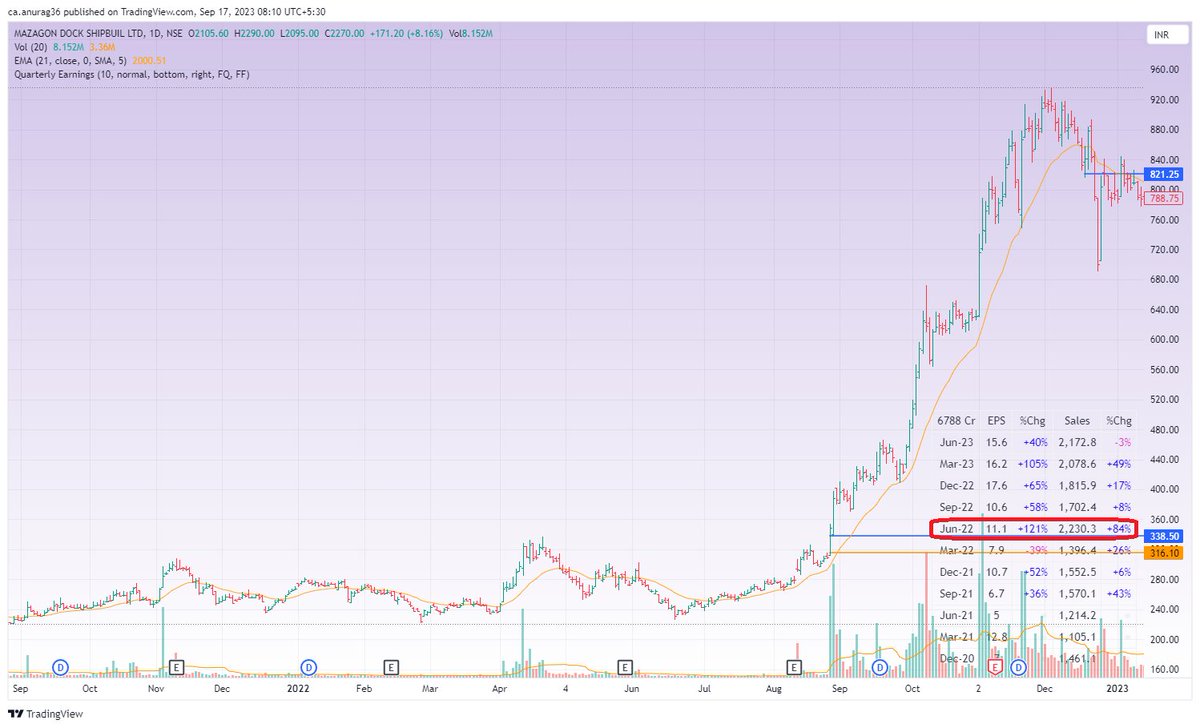
Although this stock was a big winner for me last year, the initial sell-in strength at 4R came with a high confirmation cost of ~25% on my portfolio. It can be argued that this is a case of hindsight bias but I had erred in not looking beyond the charts. My process deficiency was in not having a method to develop a stronger stock bias and aligning my pyramid and selling rules accordingly.
Mismanagement of potential magnitude trades often incurs a bigger opportunity costs than missing out on many velocity trades. Not every trade should be treated equally based on probability theory. Not every coin toss is the same.
My risk in this trade was capped by a stop-loss, trailing stop-loss for unrealized profits, low percentage risk on my portfolio, and verifying that there is sufficient liquidity to avoid slippages. To optimize rewards, I could have developed FAITH by delving deeper into the fundamental catalysts, sector, and situational awareness of the breakout, and avoiding over-management of risks. It would have made me trail or pyramid a much larger position, since it had not shown any weakness to warrant selling for a large part of the upmove.
In a bull market, when a plethora of setups are breaking out, one of the challenging and subjective decisions is to prioritize which setups to enter. Your effort-to-reward ratio will always be more accretive when you size up in stocks that are more likely to give magnitude moves and multiple pyramiding opportunities, rather than taking multiple short momentum bursts.
As you scale up your portfolio, you will realize the limitations of trading solely based on charts in the Indian markets. On my portfolio size, I rarely get more than 500 stocks in my liquidity filter (compared to ~2000 in the US). Therefore, you cannot use the same buy and sell rules which you learnt from the US market traders, as you won't get as many trades without compromising on their quality. You will need to a trail bigger sizes in your homerun trades to achieve super performance. Furthermore, relying solely on traditional bookish pivot points or obvious trendlines connecting 3-4 swing highs to buy will result in poor fills and slippages. Instead, taking a stock-first approach and prioritizing trend quality over setup quality is a much better way to scale up.
Themes and sectors are actually different, but I am using them interchangeably here. There are normally two methods which are used by traders for this
Top Down: In this method, you start by taking a bird’s-eye view of the sectoral chart and drill down to the stocks within the sector. If you use Relative Strength (RS) for sectoral charts, you are essentially deducing that the top stocks will lie in the top groups. This is very similar to the O’Neil method, and @MarketSmithIND provides you with sectoral charts. However, I personally do not use MSI because, although many of their sector groupings though theoretically sound, are practically useless. (Eg.- the Auto Manufacturers chart includes Maruti, Bajaj Auto, Olectra, and a 40 Lakh MCap India Radiators). However, there are many good fintwits who have made useful tools for this which you can test out.
Bottoms Up: Identify stocks in your watchlist that are setting up or currently in momentum within a common sector. This is often observed in commoditized sectors or when companies have common stock catalysts, such as sugar, metal, cement, insurance, lending or same ownership (e.g. Adani). The bottoms-up approach anticipates that stocks of a feather will flock together. It is typically used by more experienced traders who scan on a daily or weekly basis and, over time, develop a feel for the patterns that emerge across stocks. Although it may require more time and effort to develop, I find it to be the more effective method.
Once the sector has broken out, it is easy to spot by looking at the top movers of the day. However, most people find the need to accurately identify the next sector move beforehand. It is a valuable and expert skill to develop, but not a mandatory one for most traders.Qullamaggie, Dan Zanger, and Mark Boucher, the most successful theme traders identified what's moving and then waited for favourable entry points, rather than the other way around. They were willing to pay a higher cost for this buy confirmation, as these trends typically persist for many months. They used a "Bottoms Up" approach in top movers list to shortlist common sectors and themes, created a separate watchlist and prioritized those top movers for buying when they gave a favourable entry point. Although they were late, they were still early enough to capture the bulk of the upswing.
The market functions as a future discounting mechanism, which implies that the expected future earnings hold greater significance rather than its present or past performance. Positive past earnings are often priced into a stock by default, and can act often as a deterrent against favourable surprises which trigger significant movements in the stock price. This is where it differs from the principles of CANSLIM and most TechnoFunda fintwits.
The most important initial step in analysis is determining the triggers that will cause a particular stock to rise or fall from the present moment, rather than solely relying on past trends. The specifics of these triggers will vary for each sector, and sometimes even within each sector.
Earning catalysts, such as the example of Mazgaon earlier, are easier to identify. These can be traded through episodic pivots (see post on August 15th), which typically indicate a significant increase from the previous lacklustre earnings. If a great earnings report is followed by a gap up and range contraction, there is a high probability of a magnitude move.
Non-earning catalysts are more nuanced. While it's not necessary to become an equity research analyst, it is important over time to observe the catalysts that are relevant to the stock and sector, as well as their importance to market participants. For instance, the agricultural sector is affected by both monsoons and government policies; infrastructure stocks can emerge from debt restructuring (such as Suzlon) or receipt of overdue debtors; Chemical stocks often move when there is low un-utilised manufacturing capacity and there is a catalyst to increase demand; When considering new startup listings, sustained profit metrics may be a more relevant measure now than mere user and transaction counts, which were previously the primary pricing metric; When the Fed turns on its printers, putting even drunk sailors to shame like in 2020, nearly every company with an ISIN number will move.
Super performance requires two key elements: capital preservation and home runs. The first principle is quite well-publicized, but the second one is far less appreciated. From a portfolio perspective, when you are in favourable markets and have a hot hand, it's imperative that you press and maximize the opportunity, especially this year when most of you will be in profits. Wealth is not made by only avoiding losing years but also need a few high double digit or triple digit years.
When you develop FAITH in your positions and the market confirms that view, you can't own enough.
Super performance requires FAITH to risk large unrealized profits for larger future realised profits, and for that you often need to look beyond charts.
It takes FAITH to let go of your logic and allow the magic to happen

December 10, 2023
6 mins

August 23, 2023
6 mins

November 14, 2025
6 mins

August 5, 2023
5 mins