Mind over market
June 23, 2024
5 mins
.jpg)
A question that keeps coming up in the Indian fintwit community is how to adapt @PradeepBonde's well known 9-Million scan for Indian markets. In this article, I will try to answer that.
To solve this, we first need to understand what the 9-Million scan is actually doing in the US markets. Many of you treat this as a magical number, assuming that any stock trading 9 million volume in a day automatically signals massive institutional accumulation or an Episodic Pivot. That is not the case.
The scan is simply a starting filter to identify potential candidates based on unusually heavy volume activity. However, if you run the scan today across common stocks listed in the US markets, you will find 193 stocks trading above 9 million volume with a price filter of $3 or more (the price criteria Pradeep Bonde uses).
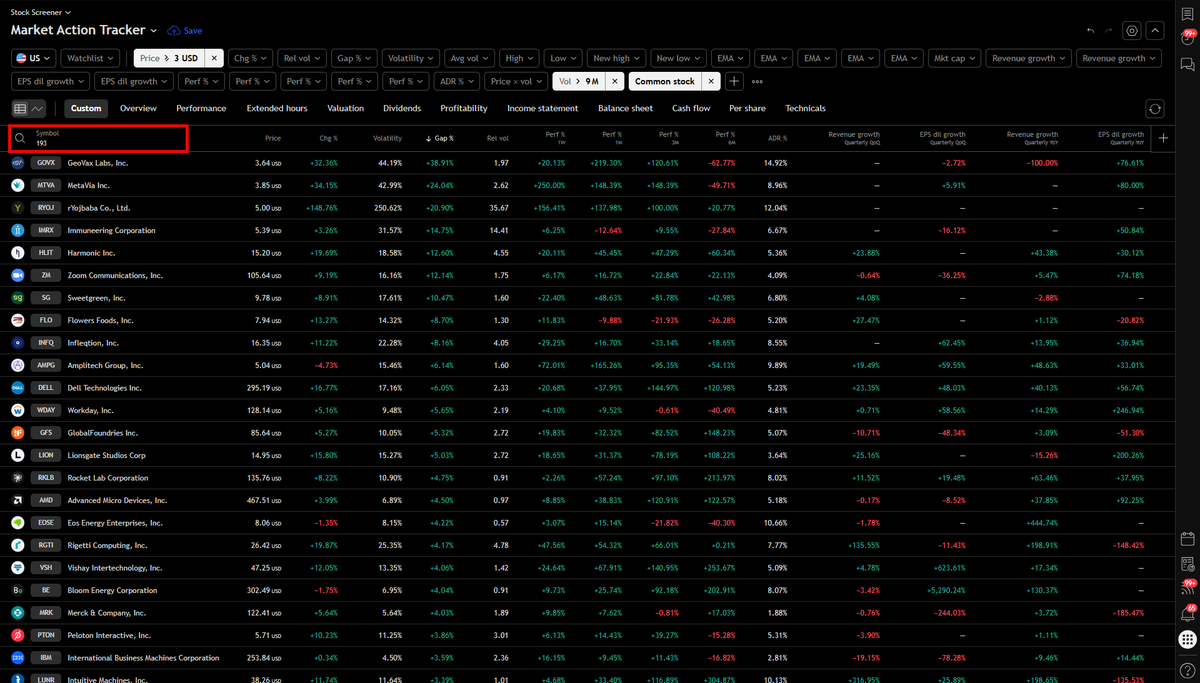
9 Million + Volume Breakouts on 22nd May, 2026
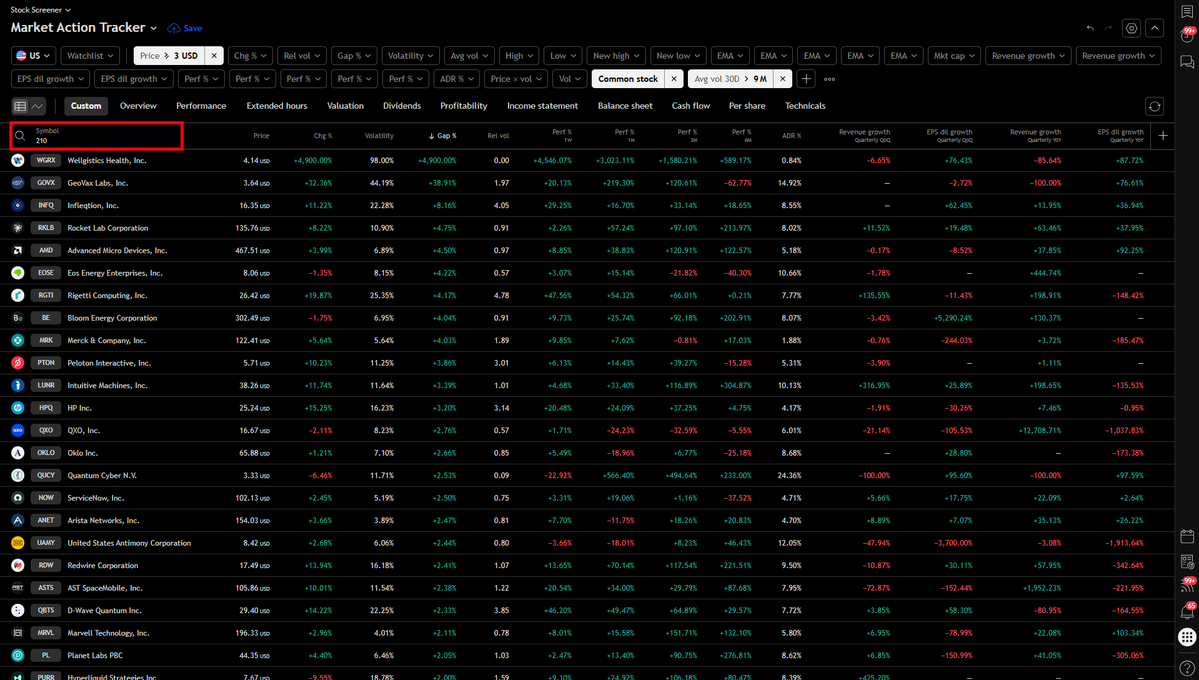
Here is another dimension to the problem. Over the last 30 days in the US markets, 210 stocks have consistently averaged 9 million plus volume with the same price filter applied. These stocks will appear on your list almost every day, not because they are breaking out or showing unusual activity, but simply because a high daily volume is their baseline. The scan cannot tell the difference, and that is the problem.
The challenge with using a static number as a filter is that it ignores stock price and liquidity entirely. Many traders in India simply lower the volume threshold, arguing that since Indian markets are less liquid, a smaller number serves the same purpose. Unfortunately, this misses the point on both counts. It reflects neither a proper understanding of what the scan is doing nor enough familiarity with how Indian markets actually behave.
When I started trading in 2013-14, the markets were far less liquid than they are today. And yet stocks like GVKPIL, GMRINFRA, and several others routinely traded 20 to 25 million shares a day. Most of these were penny stocks, and that is precisely why their volumes were so high. This is a fundamental flaw with using a static number to identify heavy volume activity: it makes no distinction between a high-priced stock with genuine institutional interest and a low-priced stock trading large volumes simply because of its price.
To put this in perspective with current data: even after removing penny stocks priced below ₹20, there are still 84 stocks in India that consistently trade above 9 million volume on a 30-day average. Today, 87 stocks crossed the 9 million mark with the same price filter. That is too large a list to go through meaningfully every day, and frankly, most of it is unnecessary.
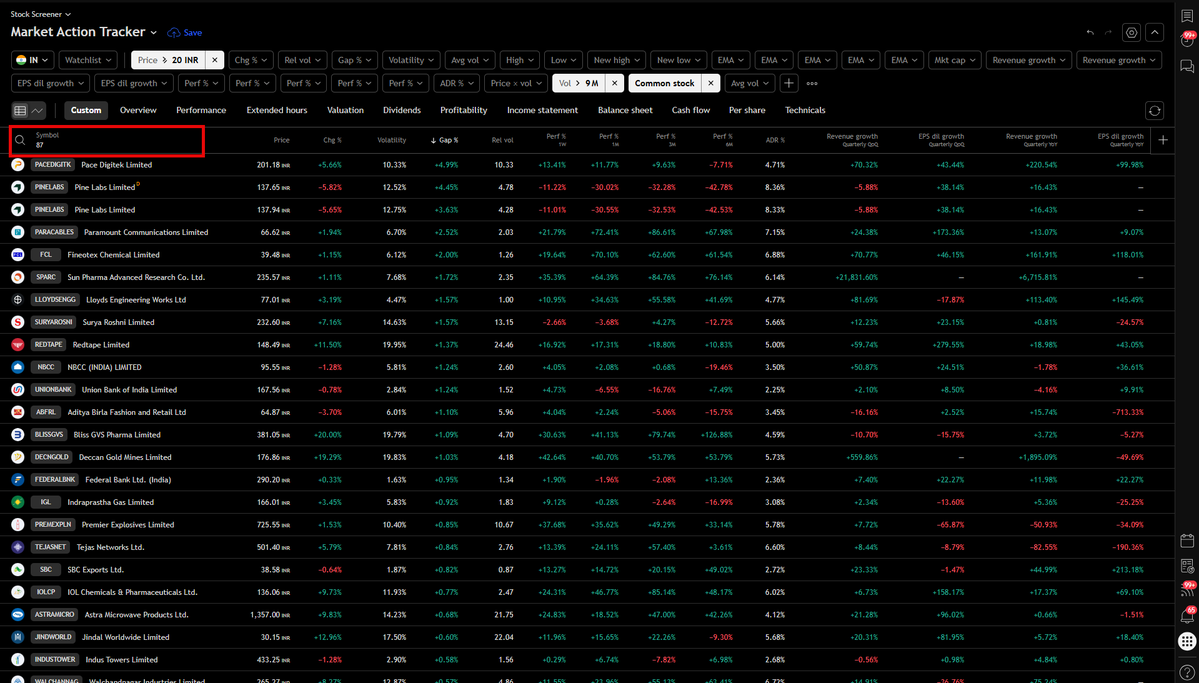
9 Million + Volume Breakouts on 26th May, 2026
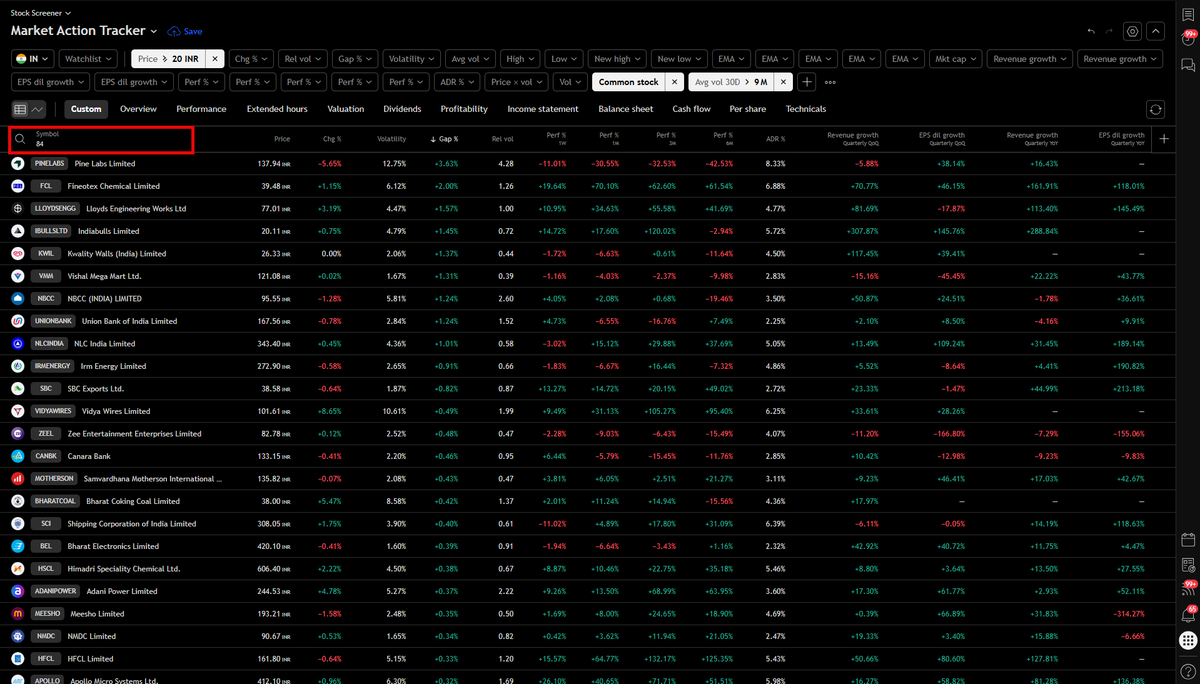
9 Million + average volume over the last 30 days
This data is not meant to discredit the scan or the process behind it. The only goal is to break the myth of the magical number. Because as long as that myth exists, we will keep hunting for such numbers throughout our trading lives, always uncertain, always second-guessing. The moment you shed that, it becomes easy to take the original idea and turn it into something more robust, more flexible, and better suited to the realities of Indian markets.
Pradeep sir put it well himself: you have to understand the core idea and the concept, not just the process. Without that understanding, having the process is of little use.
So back to the question that matters most: what is the right way to bring the idea behind the 9-Million volume scan into Indian markets? Fair warning though, the answer is probably not what you are expecting. It is not something exotic or magical. It is actually something quite common, something well known, and something most of you are already doing.
The answer is Relative Volume, or RVOL.
It serves the same purpose as the 9-Million scan, but because it is based on relativity rather than a fixed number, it adapts to every stock regardless of price range or liquidity. This single shift eliminates the core limitation of the original scan entirely.
At this point, two questions naturally come up for most people:
What lookback period should be used to calculate RVOL?
What RVOL number should be used as the cutoff for filtering?
The answer to the first question follows the same logic as before: there is no magical number. Genuine explosive volume activity will show up in the scan whether you use a 10 period, 20 period, 50 period, or anything in between. If the volume is truly exceptional, no reasonable lookback period will hide it.
For the second question, I personally use RVOL greater than 6. Again, this is not a magical number and can be adjusted based on your own preference and experience. As of today, running this scan over my Total Universe watchlist with a liquidity filter gives me 22 stocks that qualify. Sorting that list from highest to lowest RVOL puts the most explosive breakouts right at the top, making it easy to go through quickly and efficiently.
This serves the same purpose as the 9-Million scan, while fixing everything that was broken about it.
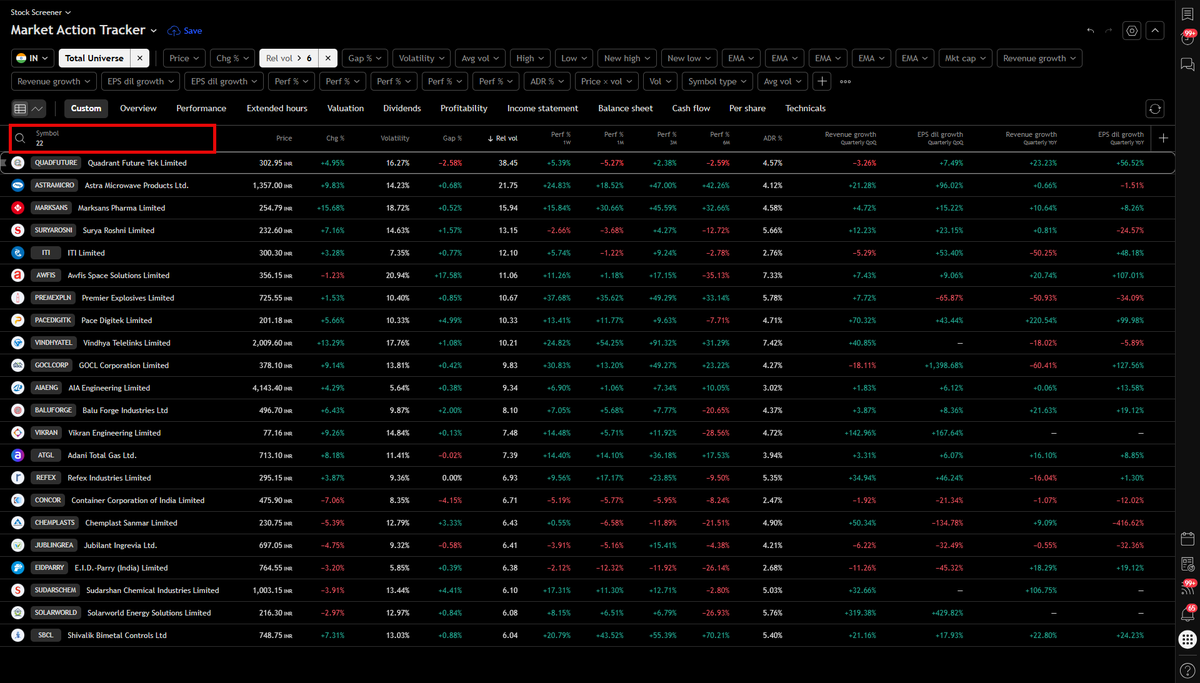
RVOL > 6 on 26th May, 2026
One adjustment worth noting is for Pradeep sir's SB scan, which combines the 9-Million volume filter with a 4% breakout criteria. If you want to replace the 9-Million volume with RVOL here, do not use a threshold of 6. Use something lower, around 3 or 4. The reason is straightforward: stocks that consistently post heavy volume will have a higher average base to begin with, which means even a genuinely explosive volume day will produce a lower RVOL reading simply because it is being measured against a larger baseline. I will cover the purpose and adaptation of the SB scan for Indian markets in a separate post soon.
Hopefully this answers the question of finding a 9-Million volume equivalent for Indian markets once and for all. But the bigger takeaway here is not the RVOL filter itself. It is the habit of looking at the core idea behind any process before adopting it, and then adapting it to suit your own market, your own universe, and your own style.

June 23, 2024
5 mins

August 12, 2024
5 mins

December 3, 2024
6 mins

August 5, 2023
5 mins

November 14, 2025
6 mins